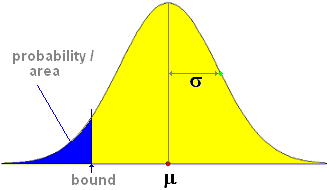
A normal distribution is defined by two parameters, μ (mu) the mean and σ (sigma) the standard deviation.
The probability distribution is a continuous, symmetric, uni-modal distribution, where only probabilities like P(X<=b) or P(X>=b) make sense.
The normal distribution with μ = 0 and σ = 1 is called the standard normal distribution. This distribution is the starting point on the screen, but you can give ì any value, and ó any positive value, and the x-axis will be adjusted.
You can drag the bounds between the blue and yellow areas.
You can change the value of μ by typing or by dragging the red circle.
You can change the value of σ by typing or by dragging the green circle.
The principle is P(X<=bound | μ; σ ) = probability corresponding to the blue area.
When the normal distribution is used for solving problems there are four parameters: bound(s), probability / area, µ and σ.
µ and σ define the dimension of the normal graph.
To a boundary belongs an area/probability and vice versa.
There is a connection between the four parameters. You can see the connection if you change/drag one of these items.
In a problem to be solved the value of one of these parameters is unknown but can be “computed” since the values of the other three parameters are known.
The types of problems can be:
Area / Probability unknown >> enter µ , σ and bound(s)
Bound unknown >> enter µ , σ and area
µ unknown >> enter σ, area and bound(s)
σ unknown >> enter µ, area and bound(s)
Under Look for parameter you can make the right choice
There is a number of options available:
Adapt graph
This is to keep the graph on the screen.
z-axis
A second horizontal axis shows the standard normal distribution (the normal distribution with μ = 0 and σ = 1) obtained by standardizing the current normal random variable.
Boxplot
A boxplot is shown under the normal plot.